Main resources
Overview
{warwickplots} is an R package with colour palettes and a ggplot2 theme that are consistent with The University of Warwick’s branding, especially its colours and typography.
The palettes are built using the palettes package. The ggplot2 theme is heavily inspired by the work of Cara Thompson, particularly this talk on applying a unifying aesthetic to your plots.
Installation
You can install the development version of warwickplots from GitHub with:
# install.packages("remotes")
remotes::install_github("Warwick-Stats-Resources/warwickplots")
Palettes
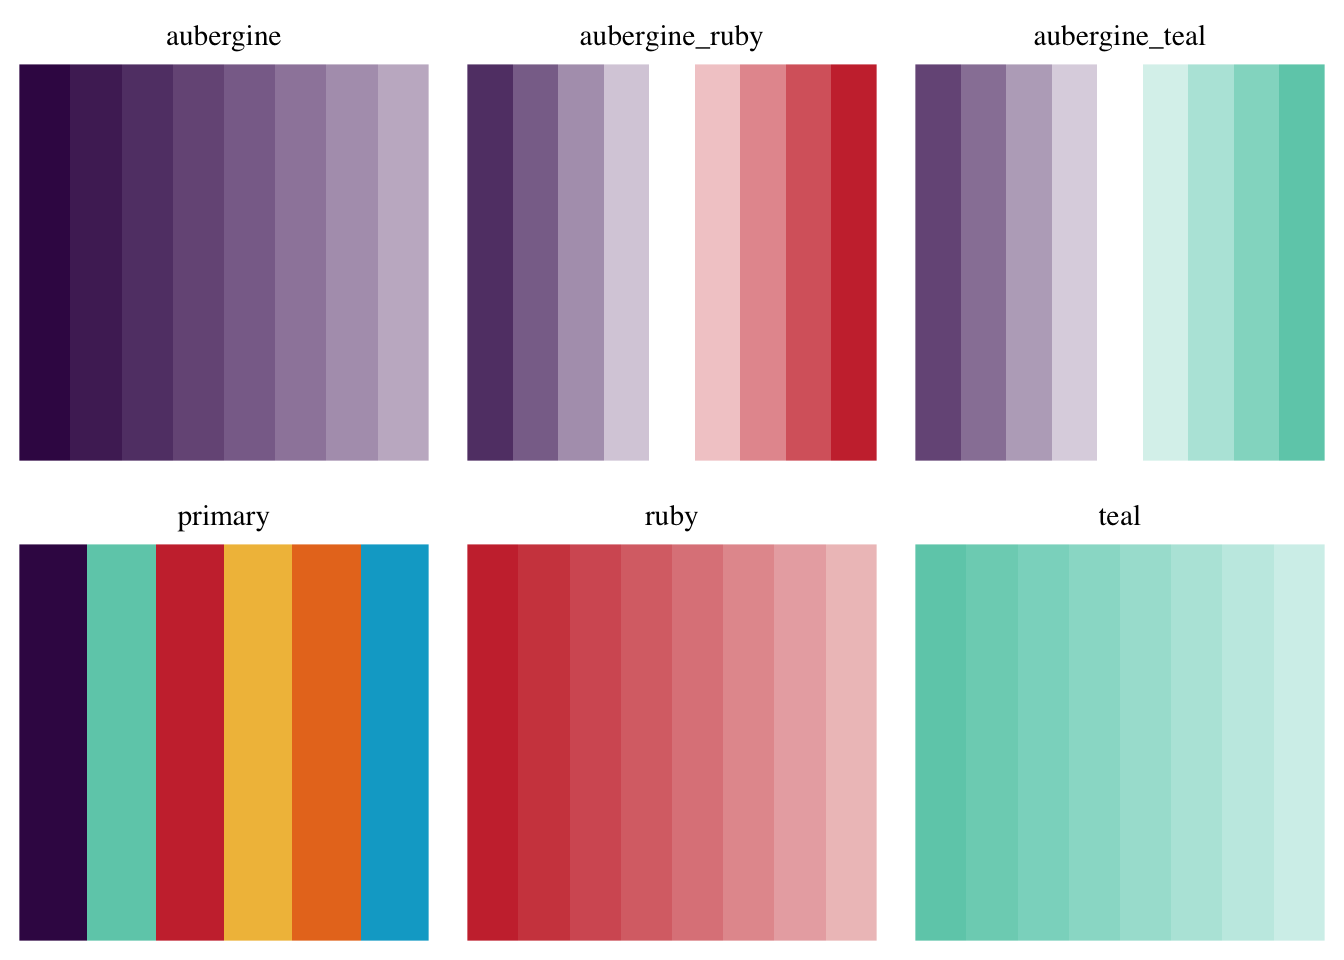
The package offers six colour palettes: one discrete, two divergent and three sequential:
For further details on using the palettes, please see the get started with warwickplots vignette and the documentation for the palettes package.
theme_warwick()
Below is a plot that uses the warwick_palettes::primary palette and theme_warwick().

theme_warwick() is an extension of ggplot2::theme_minimal(), offering the following in addition:
- Text hierarchy, with different sizes and colours
- Spacing, giving the text room to breathe
- Uses
ggtext::element_textbox_simple()for the plot title and subtitle, to enable use of markdown and CSS styling, and text-wrapping if the title/subtitle is long - Places the legend above the plot
- Uses Lato or Avenir Next font (for online or print use respectively), if your system is set up for it
Note that any theme_warwick() defaults can be overridden with a subsequent call to theme().
For further details, including how to ensure your system is set up to use custom fonts, see the get started warwickplots vignette. For further examples, including how to override theme_warwick(), see the using warwickplots with ggplot2 vignette.